> For the complete documentation index, see [llms.txt](https://bemind.gitbook.io/neural/llms.txt). Markdown versions of documentation pages are available by appending `.md` to page URLs; this page is available as [Markdown](https://bemind.gitbook.io/neural/neuralprophet/novye-uroki/urok-4-avtoregressiya.md).
# Урок 4: Авторегрессия
Авторегрессия — это модель временных рядов, которая использует наблюдения из предыдущих временных шагов в качестве входных данных для уравнения регрессии, чтобы предсказать значение на следующем временном шаге.
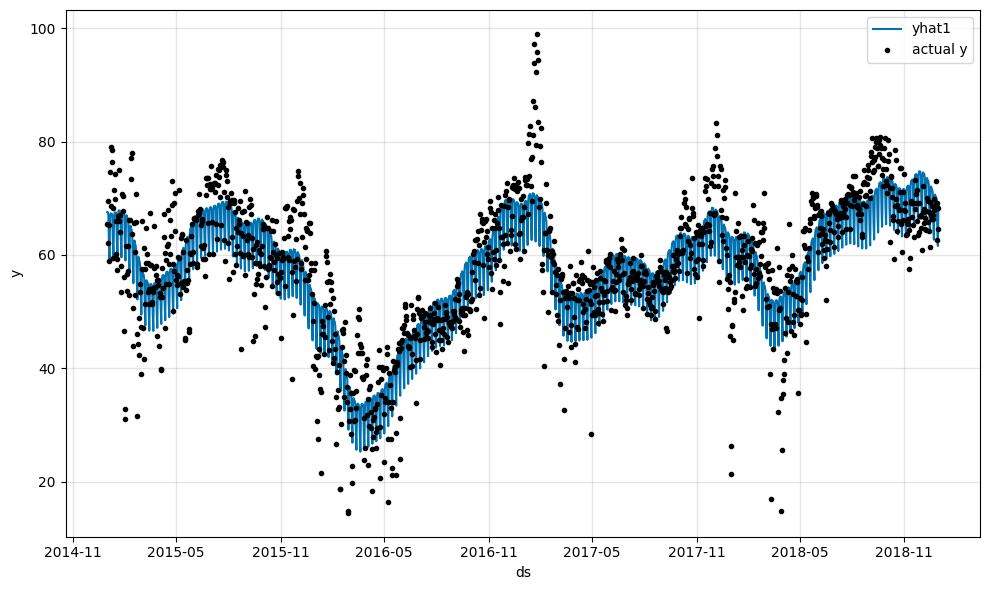
Мы начинаем с той же модели, что и в предыдущем учебнике.
```python
import pandas as pd
from neuralprophet import NeuralProphet, set_log_level
# Отключение сообщений журнала, кроме случаев ошибок
set_log_level("ERROR")
# Загрузка набора данных из CSV-файла с помощью pandas
df = pd.read_csv("https://github.com/ourownstory/neuralprophet-data/raw/main/kaggle-energy/datasets/tutorial01.csv")
# Модель и прогнозирование
m = NeuralProphet(
n_changepoints=10,
yearly_seasonality=True,
weekly_seasonality=True,
daily_seasonality=True,
)
m.set_plotting_backend("plotly-static")
metrics = m.fit(df)
forecast = m.predict(df)
m.plot(forecast)
```
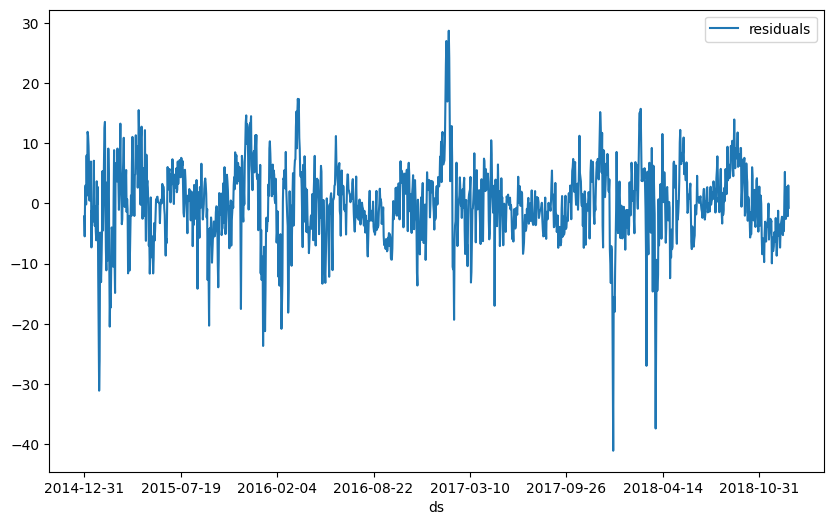
Чтобы лучше понять, в чем заключается оставшееся несоответствие между нашей моделью и реальными данными, мы можем посмотреть на остатки. Остатки представляют собой разницу между прогнозом модели и реальными данными. Если модель идеальна, остатки должны быть равны нулю.
```python
df_residuals = pd.DataFrame({"ds": df["ds"], "residuals": df["y"] - forecast["yhat1"]})
fig = df_residuals.plot(x="ds", y="residuals", figsize=(10, 6))
```
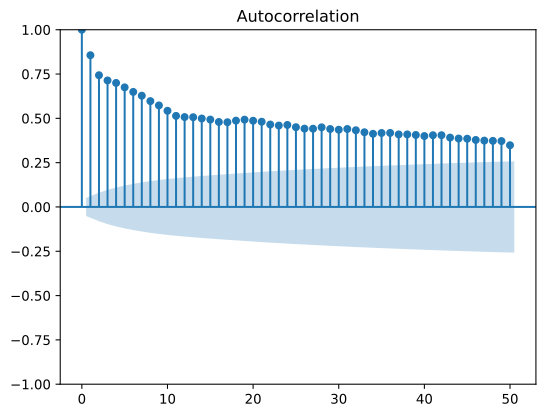
Давайте изучим, какое значение авторегрессии будет хорошим. Создайте график автокорреляции.
```python
from statsmodels.graphics.tsaplots import plot_acf
plt = plot_acf(df_residuals["residuals"], lags=50)
```
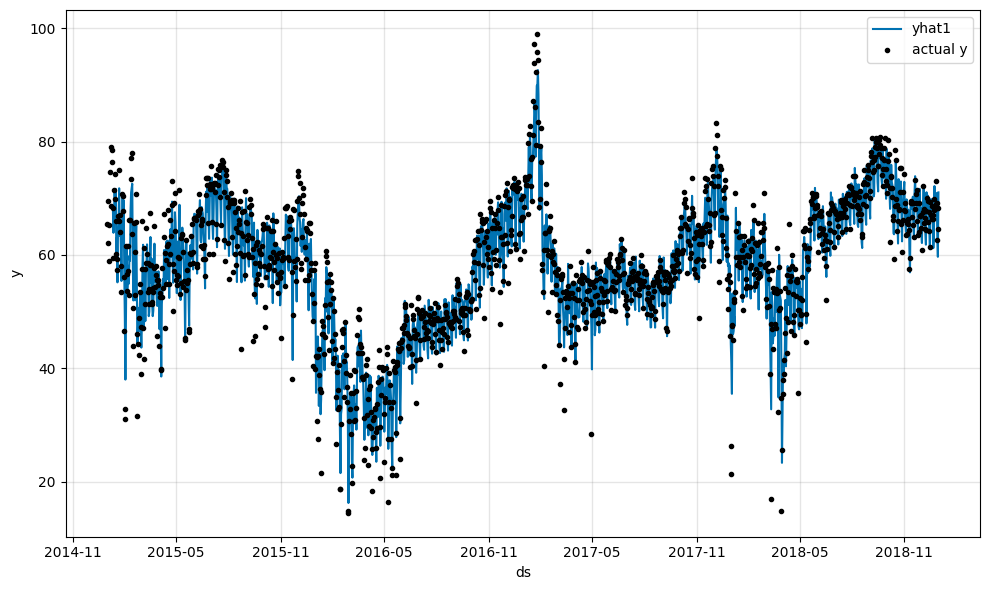
Теперь мы добавляем авторегрессию в нашу модель с параметром `n_lags`
```python
# Модель и прогнозирование
m = NeuralProphet(
# Отключение точек изменения тренда
n_changepoints=10,
# Отключение компонентов сезонности
yearly_seasonality=True,
weekly_seasonality=True,
daily_seasonality=True,
# Добавление авторегрессии
n_lags=10,
)
m.set_plotting_backend("matplotlib") # Использование matplotlib из-за #1235
metrics = m.fit(df)
forecast = m.predict(df)
m.plot(forecast)
```
Как мы видим, модель прогнозирования с авторегрессией значительно лучше подходит к данным, чем базовая модель. Не стесняйтесь исследовать, как различное количество лагов `n_lags` влияет на модель.
```python
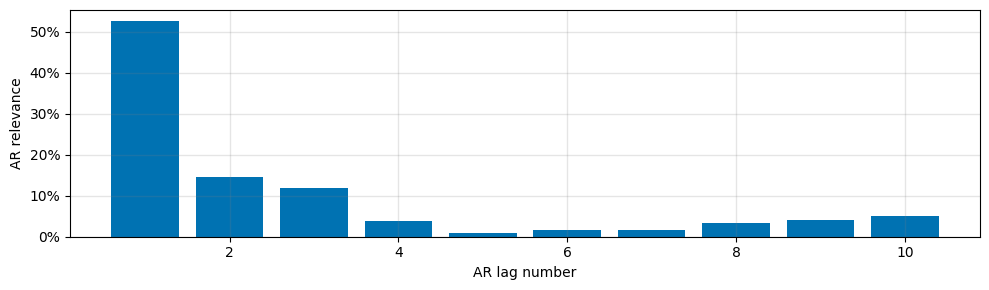
m.plot_parameters(components=["autoregression"])
```
```python
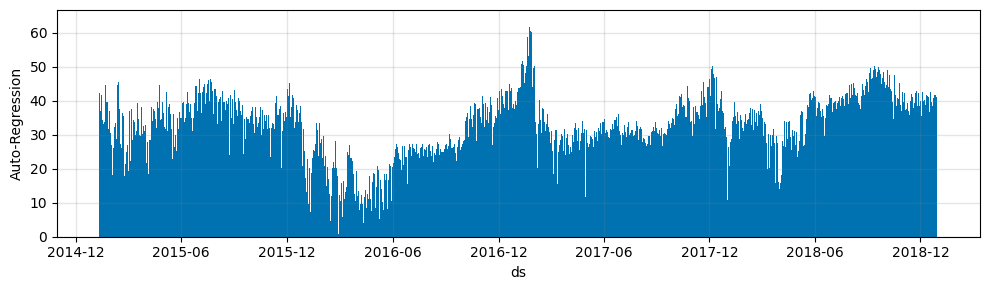
m.plot_components(forecast, components=["autoregression"])
```